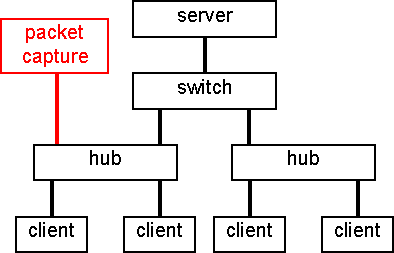
Figure 1: Switch-based benchmark configuration with packet capture machine on client hub
The standard benchmark for NFS file server performance, SPEC SFS (also known as LADDIS), measures performance in terms of both throughput -- the aggregate amount of data a file server can move across the network per unit of time -- and response time -- the time required to service an individual client request. NetBench, the most commonly used file server benchmark for the CIFS (or SMB) protocol measures only throughput. Network Appliance believes response time is as important a performance metric as throughput, especially in the highly interactive environment typical of CIFS networks, since throughput offers little solace to a user waiting to access a file.This paper documents the methodology and tools developed to measure response time during a NetBench run. While cumbersome and primitive, useful data has been produced, demonstrating that the fundamental idea is sound. SPEC SFS has had a noticeable effect on vendors of NFS file servers, motivating them to improve response time from an average of 50ms in 1993 to less than 10ms in 1997. Given the ability to measure response time in the CIFS environment, hopefully a similar improvement can be encouraged in CIFS file servers.
"Never underestimate the bandwidth of a station wagon full
of tapes hurtling down the highway." - Andrew Tanenbaum
Throughput is an important metric for file server performance, but for individual, interactive users, good response time is far more critical. The standard benchmark for NFS file servers, SPEC SFS (also known as LADDIS) [1,2], measures both. When Network Appliance introduced support for the CIFS (or SMB (note 1)) protocol [3], we wanted to measure both attributes of our file server's performance using this new protocol, but were disappointed to find that the file server portion of NetBench [4](note 2), only measures throughput.
The desire to have response time data led us to prototype a process which would permit measurement of response times during the course of a NetBench run. While the tools and methods are a crude hack, the project was successful enough to produce useful results [5], and the tools were further refined and used with a subsequent NetBench run on a larger, more interesting configuration [6].
Since NetApp does not have source code for NetBench, we could not enhance it with the time-stamping features of SPEC SFS. Even with the source, we might not have been able to do so -- SPEC SFS is a synthetic benchmark [7], which generates the desired sequence of NFS requests, but NetBench is an application-level benchmark, generating relatively high-level file system calls. Not only doesn't a single call necessarily have the one-to-one correspondence with an SMB (a single CIFS transaction), as would be needed to measure the response time of a single operation, it might not even be generating SMB calls at all if, for example, it were being used to evaluate a PC NFS product.
Instead of modifying the benchmark itself, we captured network traffic between the server and a typical client. The resulting packet trace was subsequently analyzed off-line, matching client requests with the corresponding response packet(s) from the server and then computing the response time. The result does not reflect the time spent in the client's network protocol stack, unlike SPEC SFS, but the results can be meaningfully compared for two different CIFS file servers.
An additional benefit of this approach is that response time can be measured for any CIFS traffic, so other benchmark suites such as BAPCo's SYSmark for File Servers [8], could be substituted. (The response time tools might need to be enhanced to understand SMBs not encountered in the NetBench runs, but the hooks are in place to make this a relatively simple process.)
The test networks used were reasonably standard ones for NetBench, with client (load-generator) machines distributed evenly across multiple 100Base-TX networks. The key modification was the addition of a machine to capture packets flowing between a selected client and the server. In the early runs, this machine was on a hub with the server. This allowed us to select a different client on the fly in case the one initially being monitored dropped out of test. This flexibility did not prove to be necessary, and the packet capture machine was moved to a hub with the client to be monitored, as shown in Figure 1. This permitted the use of a dedicate switch port (or ports) to the server, a more typical configuration for a large installation.
The large number of clients used in a NetBench run (our largest configuration used 200 clients, plus a few spares) makes a fully-switched network -- with even the clients on dedicated switch ports -- an unlikely scenario. However, this setup may be desirable for other benchmarks. It poses a problem since no shared networks are available on which to place the packet capture machine. Fortunately, many switches allow a monitoring port to be configured to which packets from one or more other ports are directed.
During the course of a NetBench run, the packet capture is started immediately after the client starts running the mix (one data point of the benchmark) and stopped shortly before completion. This is an exceedingly tedious process, but no hooks which can be used to automatically trigger and terminate the packet capture are apparent within NetBench. The packets missed at the beginning and end of this process are not a great concern since a large sample is still obtained.
In the early stages of this effort, Cinco Networks' NetXRay software [9] was used to perform the packet capture. It ran on a spare PC in our lab, and could decode SMB traffic, "printing" the decoded trace to a file. This reduced the time required to develop the Perl script used to analyze the data, but not the execution time of the analysis. When we started working with large samples, we found that the printer drivers were intolerably slow, and NetXRay occasionally died while attempting to decode some packets. We ended up writing our own decoding tool, but NetXRay's decoding served our prototyping process well.
A discussion in the SPECweb mailing list led us to suspect the
resolution of the times reported by NetXRay
[10].
An NT version of the SPECweb96 benchmark had been released, but it was
discovered that the NT timer resolution was "only tens of milliseconds
at best." Several Ultra SPARCs were in our lab as SPEC SFS load
generators. The
While
The moral of this is that during benchmark runs for which accurate timing is important, a dedicated packet capture device such as a Network General Sniffer [11]. is probably a worthwhile investment, instead of trying to make a general-purpose computer perform this specialized job well. (One would have thought that since Network Appliance promotes the value of dedicated, appliance-like devices for specific tasks, we would have realized this sooner!)
The core of the response time measurement is an analysis tool which studies the captured packet traces, looking for SMB commands and the corresponding replies from the server. The time-stamps on the captured packets are used to compute the time from when the first part of the command appeared on the network until the last packet of the response appeared. This tool was written in Perl for convenience of initial implementation and modification. It's quite slow and uses a prodigious amount of memory. Rewriting it in C would speed it up immensely, and perhaps reduce the memory demands, but it isn't run that often and we can obtain the resources when needed, and thus have not felt sufficient need to justify the investment in a full rewrite of the code.
The analysis is broken into three passes. The first pass scans the input, doing basic lexical analysis and sanity checking, then converting the data into an internal format. TCP sequence numbers are studied to catch packets retransmitted by TCP because they were not acknowledged by the receiver, and, with packet length information, to detect when packets have been dropped by the packet capture process. Packets which are continuations of an SMB command or response which required multiple packets are linked back to the initial packet.
The second pass ensures that at least the first and last packet of a multiple packet command or response are present. (Intermediate packets aren't important since they don't influence the overall response time of the operation.) More error checking is done and various counts are updated.
The third analysis pass examines packets which are the initial packet of an SMB command. The command is matched to a response based on Multiplex ID, with TCP sequence numbers and other consistency checks used to ensure that a response is indeed the one which corresponds to the command. (Multiplex IDs recycle, and protracted packet drops can lead to unfortunate coincidences if one is not careful.) If all the checks pass and the last packet of the command is present, the response time is computed by subtracting the time-stamp on the initial packet of the command from the final packet of the response and then tabulated.
Determining a meaningful response time for the Write_Raw SMB poses an interesting challenge, as if the many artifacts of the data collection process where not challenge enough. This SMB begins with the client sending a relatively small chunk of initial data along with a reservation request for a much larger (up to 65,535 bytes) block of data. The server saves the initial data, reserves space for the large block of data, and responds to the client. The client then sends the block of data.
In the most frequently observed case, the server does not generate any response to acknowledge the receipt of the block of data. Any error is reported to the client in the next access to the file handle. This access can be arbitrarily far in the future, so there is no way to measure the response time for this portion of a Write_Raw command.
Without any direct acknowledgment of these SMBs, there is no way to measure response time for these operations in their entirety from a passive, external observation. (A TCP acknowledgment is generated, perhaps as part of another response, but this has no relationship to when the command actually completed.) These operations are therefore reported in two parts, the initial portion, including its response time, and the second, asynchronous portion.
Appendix A is an example report, taken from the 80-client data point of a NetBench run against a Network Appliance F630 filer (file server appliance) running an early version of Data ONTAP 4.1. This is just one of seven reports from one NetBench run -- obviously a more compact presentation is desirable for easy comparison and reference.
SPEC SFS combines response times into one number for each data point. We were not comfortable with the idea of collapsing the data that much for our work, both because we weren't sure if doing so would be meaningful, and because we were trying to compare two different dialects of the CIFS protocol -- NetApp software does not yet implement the NT dialect, which has some extensions that offer significant performance benefits. We chose to sort the SMBs observed in the data into four groups of similar operations (detailed in Table 1) and to report response times for each group. Subsequent analysis was based on these groupings.
Minimum, maximum, and median response time are included in the report, along with the average response time. Except during debugging, the average has been the most interesting statistic.
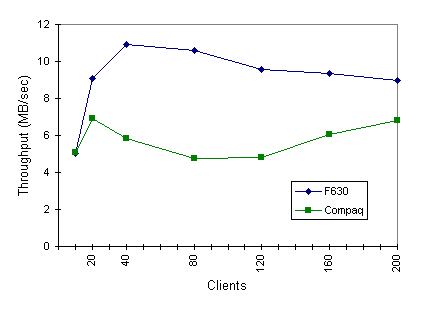
Figure 2 shows the throughput results from NetBench against a NetApp F630 and a Compaq ProLiant 5000 with hardware RAID running Windows NT. The system configurations are summarized in Table 2; further details along with the complete benchmark results are in [6].
|
The drop-off in throughput of NT beyond 20 clients was expected -- previous tests had shown that the performance of the Compaq suffered greatly once the working set exceeded memory size [5].
What was surprising was the improvement in throughput for the
Compaq once the working set exceeded the server's memory. This caused
considerable consternation for several weeks, until the response time
analysis software could be reworked to handle the
The response time data finally helped explain this seemingly bizarre behavior. Figure 3 shows the response time for the Read group of SMBs for both of the servers tested. (Response times from the other SMB groups in Table 1 are presented in [6].) When the Compaq's throughput began to increase, the slope of the response time curve increases significantly -- a steep price for the increased throughput. One plausible explanation is that NT switches algorithms as the load increases, from one tuned to provide clients with the best performance to one tuned for the convenience of the server. (Anecdotal evidence suggests that this sort of non-linear behavior is not unprecedented in NT benchmarking.)
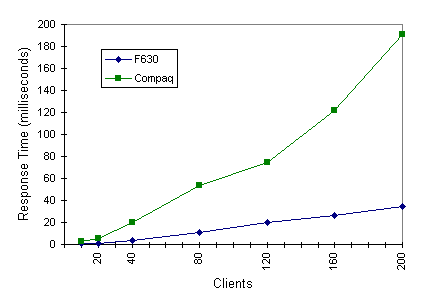
The Network Appliance F630, in contrast to the Compaq running NT, degraded gracefully under increased load. Response time began low and stayed relatively low, an expected (and intended) benefit of NetApp's micro-kernel software architecture [12,13].
Studying file server response time is an interesting and enlightening exercise. Ideally, response time measurement is built into the benchmark. Lacking that, passively monitoring network traffic while running an existing benchmark and analyzing the packet traces off-line, despite being a crude hack, can produce useful response time data.
To encourage further studies in this area, the tools described in this paper will be made available in the free software section of Network Appliance's web site, http://www.netapp.com/technology/free.html. Please send any enhancements or fixes to this software to the author at kls@netapp.com.
***********************
*  f630 - 80 clients  *
***********************

Packets:         91748
   IP/TCP:       74112   80.8%
   IP/TCP Ack:   17623   19.2%
   IP/TCP UAk:      13    0.0%

   retrans:          6    0.0%
   dropped:       7065 (or more)

Continue:        26787   29.2%

Commands:        44510   48.5%

   SMB:          23665   53.2%
   continue:     12614   28.3%
      sync:       5907         46.8%
      async:      6707         53.2%
   TCP ack:       8219   18.5%
   TCP retry:       13    0.0%

Elapsed time:   000:10:51.79540 (651.79540 seconds)

                                   Avg.
SMB Command          Count  % Tot  Pkts Fastest Slowest  Median Average  StdDev
-----------          -----  -----  ---- ------- -------  ------ -------  ------
Check_Directory        235   1.0%   2   0.00032 0.03820 0.00724 0.00890  0.0049
Close_File            1412   6.0%   2   0.00021 0.04957 0.00729 0.00869  0.0049
Delete_File            269   1.1%   2.0 0.00096 1.64518 0.00811 0.04184  0.1945
Find_Close2            474   2.0%   2   0.00016 0.03768 0.00722 0.00869  0.0047
Flush_File              65   0.3%   2.0 0.00234 0.02620 0.00707 0.00865  0.0046
Get_File_Attributes   2062   8.7%   2.0 0.00026 0.15250 0.00753 0.00914  0.0055
Get_File_Attributes2  1264   5.3%   2   0.00034 0.04445 0.00686 0.00777  0.0043
Locking+X              289   1.2%   2   0.00048 0.03927 0.00702 0.00842  0.0046
Open+X                1863   7.9%   2   0.00029 0.04770 0.00751 0.00911  0.0047
Read+X                8735  36.9%   3.6 0.00020 0.17699 0.00732 0.01063  0.0126
Rename_File             41   0.2%   2   0.00143 0.02945 0.00771 0.00969  0.0049
Set_File_Attributes      1   0.0%   2   0.01390 0.01390 0.01390 0.01390
Transaction2           820   3.5%   2.0 0.00032 0.09482 0.00779 0.00967  0.0060
   Find_First          469   2.0%   2   0.00073 0.09482 0.00755 0.00943  0.0063
   Find_Next           266   1.1%   2   0.00032 0.04912 0.00848 0.01000  0.0055
   Get_FS_Info          85   0.4%   2   0.00390 0.03716 0.00792 0.00997  0.0056
Write_Bytes           5716  24.2%   2.8 0.00034 0.77066 0.00774 0.01010  0.0179
Write_Raw              261   1.1%   7.1 0.00699 0.20911 0.02325 0.02672  0.0157
   async portion                   25.5

Groups:
   Open/Close         3275  13.8%   2.0 0.00021 0.04957 0.00739 0.00893  0.0048
   Other              5455  23.1%   2   0.00016 1.64518 0.00727 0.01043  0.0441
      Attributes      3412  14.4%   2   0.00026 0.15250 0.00719 0.00866  0.0052
      Directory       1754   7.4%   2   0.00016 1.64518 0.00751 0.01422  0.0773
      Locking          289   1.2%   2.0 0.00048 0.03927 0.00702 0.00842  0.0046
   Read               8735  36.9%   3.6 0.00020 0.17699 0.00732 0.01063  0.0126
   Write              6042  25.5%   3.0 0.00034 0.77066 0.00789 0.01080  0.0181

Response time distributions per command:

   Check_Directory:
        <0.001       4    1.7%    1.7%
        <0.01      155   66.0%   67.7%  *********************
        <0.1        76   32.3%  100.0%  **********

   Close_File:
        <0.001      31    2.2%    2.2%
        <0.01      981   69.5%   71.7%  ***********************
        <0.1       400   28.3%  100.0%  *********

   Delete_File:
        <0.001       1    0.4%    0.4%
        <0.01      159   59.1%   59.5%  *******************
        <0.1       101   37.5%   97.0%  ************
        <1           4    1.5%   98.5%
        <10          4    1.5%  100.0%

   Find_Close2:
        <0.001       8    1.7%    1.7%
        <0.01      334   70.5%   72.2%  ***********************
        <0.1       132   27.8%  100.0%  *********

   Flush_File:
        <0.01       51   78.5%   78.5%  **************************
        <0.1        14   21.5%  100.0%  *******

   Get_File_Attributes:
        <0.001      25    1.2%    1.2%
        <0.01     1310   63.5%   64.7%  *********************
        <0.1       726   35.2%  100.0%  ***********
        <1           1    0.0%  100.0%

   Get_File_Attributes2:
        <0.001      35    2.8%    2.8%
        <0.01      980   77.5%   80.3%  *************************
        <0.1       249   19.7%  100.0%  ******

   Locking+X:
        <0.001       4    1.4%    1.4%
        <0.01      219   75.8%   77.2%  *************************
        <0.1        66   22.8%  100.0%  *******

   Open+X:
        <0.001      15    0.8%    0.8%
        <0.01     1225   65.8%   66.6%  *********************
        <0.1       623   33.4%  100.0%  ***********

   Read+X:
        <0.001     105    1.2%    1.2%
        <0.01     6031   69.0%   70.2%  ***********************
        <0.1      2562   29.3%   99.6%  *********
        <1          37    0.4%  100.0%

   Rename_File:
        <0.01       26   63.4%   63.4%  *********************
        <0.1        15   36.6%  100.0%  ************

   Set_File_Attributes:
        <0.1         1  100.0%  100.0%  *********************************

   Transaction2:
        <0.001       3    0.4%    0.4%
        <0.01      519   63.3%   63.7%  *********************
        <0.1       298   36.3%  100.0%  ************

   Transaction2 (Find_First):
        <0.001       1    0.2%    0.2%
        <0.01      320   68.2%   68.4%  **********************
        <0.1       148   31.6%  100.0%  **********

   Transaction2 (Find_Next):
        <0.001       2    0.8%    0.8%
        <0.01      146   54.9%   55.6%  ******************
        <0.1       118   44.4%  100.0%  **************

   Transaction2 (Get_FS_Info):
        <0.01       53   62.4%   62.4%  ********************
        <0.1        32   37.6%  100.0%  ************

   Write_Bytes:
        <0.001      54    0.9%    0.9%
        <0.01     3702   64.8%   65.7%  *********************
        <0.1      1954   34.2%   99.9%  ***********
        <1           6    0.1%  100.0%

   Write_Raw (synchronous portion only):
        <0.01        3    1.1%    1.1%
        <0.1       257   98.5%   99.6%  ********************************
        <1           1    0.4%  100.0%

   Group - Open/Close:
        <0.001      46    1.4%    1.4%
        <0.01     2206   67.4%   68.8%  **********************
        <0.1      1023   31.2%  100.0%  **********

   Group - Other:
        <0.001      80    1.5%    1.5%
        <0.01     3702   67.9%   69.3%  **********************
        <0.1      1664   30.5%   99.8%  **********
        <1           5    0.1%   99.9%
        <10          4    0.1%  100.0%

   Group - Other.Attributes:
        <0.001      60    1.8%    1.8%
        <0.01     2343   68.7%   70.4%  **********************
        <0.1      1008   29.5%  100.0%  *********
        <1           1    0.0%  100.0%

   Group - Other.Directory:
        <0.001      16    0.9%    0.9%
        <0.01     1140   65.0%   65.9%  *********************
        <0.1       590   33.6%   99.5%  ***********
        <1           4    0.2%   99.8%
        <10          4    0.2%  100.0%

   Group - Other.Locking:
        <0.001       4    1.4%    1.4%
        <0.01      219   75.8%   77.2%  *************************
        <0.1        66   22.8%  100.0%  *******

   Group - Read:
        <0.001     105    1.2%    1.2%
        <0.01     6031   69.0%   70.2%  ***********************
        <0.1      2562   29.3%   99.6%  *********
        <1          37    0.4%  100.0%

   Group - Write:
        <0.001      54    0.9%    0.9%
        <0.01     3756   62.2%   63.1%  ********************
        <0.1      2225   36.8%   99.9%  ************
        <1           7    0.1%  100.0%

Warnings:
   final packet of SMB missing:                     24    0.0%
   final packet of response missing:                21    0.0%
   preceding packet(s) dropped:                   7065    7.7%
   response MID mismatch; looking ahead:           137    0.1%
   response MID not matched after 4 attempts:      137    0.1%
   retransmitted or out-of-order packet:             6    0.0%